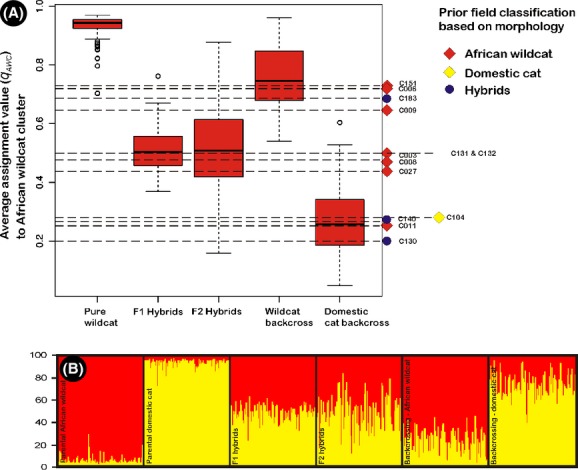
Figure 4.

(A) Boxplots illustrating the variation in assignment probabilities to the African wildcat genetic cluster (qAWC) based on simulated genotypes for pure parental African wildcat (AWC), F1, F2, and backcrossed individuals identified in STRUCTURE. Dashed lines indicate actual qAWC –values of admixed individuals obtained from our field-collected data that did not assign with high probability (qAWC/DC ≥0.8) to any of the parental genetic clusters. (B) STRUCTURE bar plots of simulated pure parental, F1, F2, and backcrossed genotypes (100 each). Membership of each individual's genome (qAWC/DC) to the two genetic clusters (domestic, yellow and African wildcat, red) is indicated by vertical bars.
