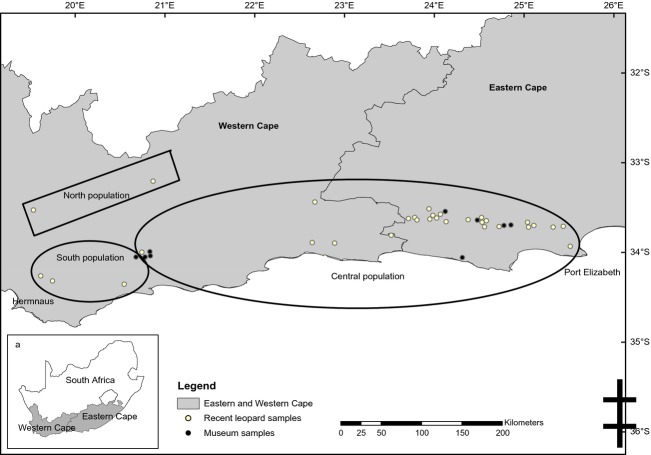
Figure 1.
Study area within South Africa (a) where shading indicates the location of the Eastern and Western Cape. The location of 40 samples (recent and museum) collected from the study area. Sample locations enveloped by black polygons denote which of the three subpopulations (K = 3) the sample was assigned to as defined by GENELAND “north population,” “south population,” and “central population.”

