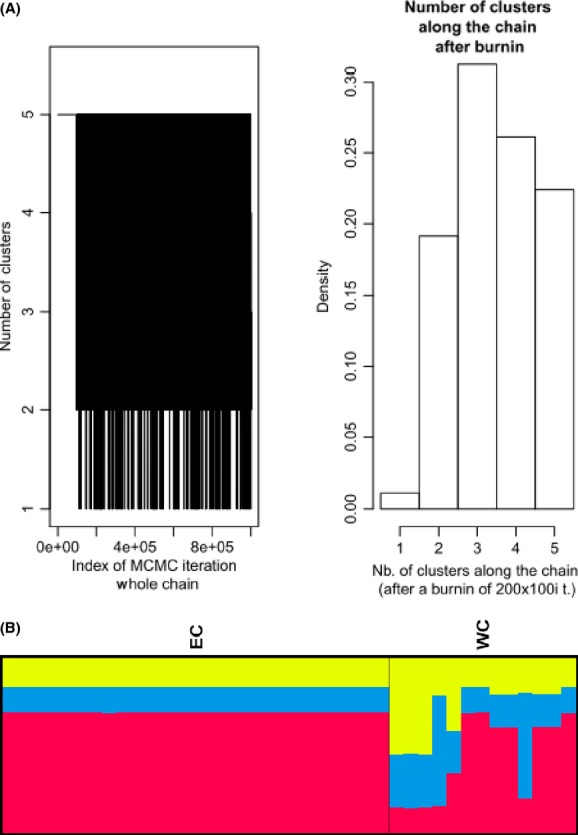
Figure 2.

Estimated number of populations from GENELAND. (A) Posterior density distribution of the number of clusters estimated from GENELAND analysis. (B) Estimated population structure from GENELAND analyses for the model solutions K = 3. Each individual is represented by a thin horizontal line divided into K colored segments that represent the individual's estimated membership fractions in K clusters. Black lines separate individuals from different geographic areas labeled at the bottom.
