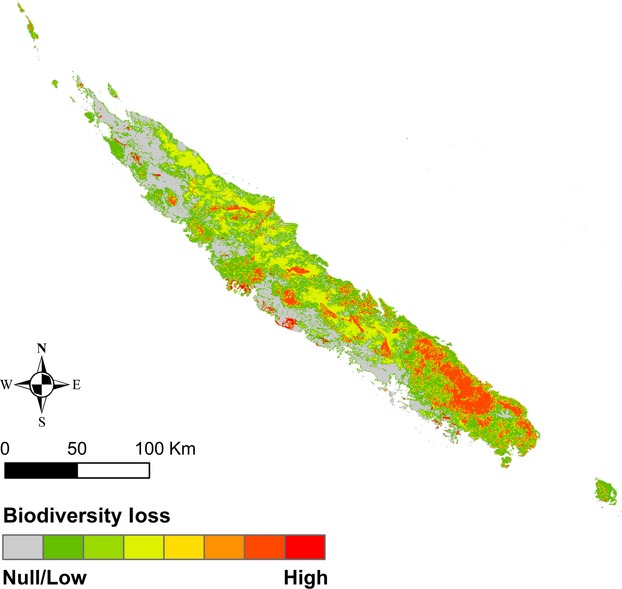
Figure 3.

Potential biodiversity loss index mapping representing both direct potential loss through diversity and long-term potential loss through vulnerability. This index varied from 0 for secondary units (e.g., savannas) to 0.083 for sclerophyll forests.
