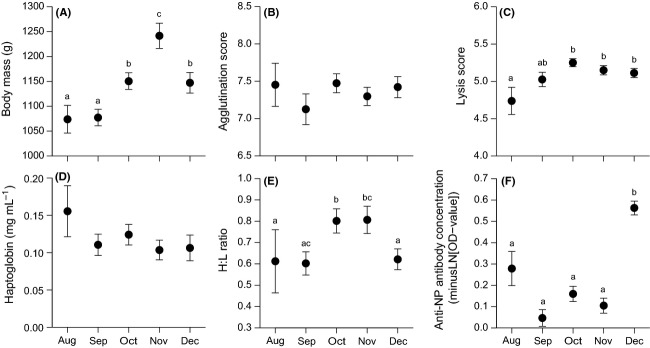
Figure 2.

Raw data of body mass and immune status (mean ± SE) of free-living mallards from August until December 2010. (A) Body mass, (B) agglutination score (NAbs), (C) lysis score (complement), (D) haptoglobin (Hp) concentration, (E) H:L ratio (heterophils to lymphocytes ratio), and (F) anti-NP antibody concentration. The letters in panel A, C, E, and F refer to monthly differences (significant levels from the Tukey's test). Note: y-axis of anti-NP antibody concentrations is minusLN-scaled.
