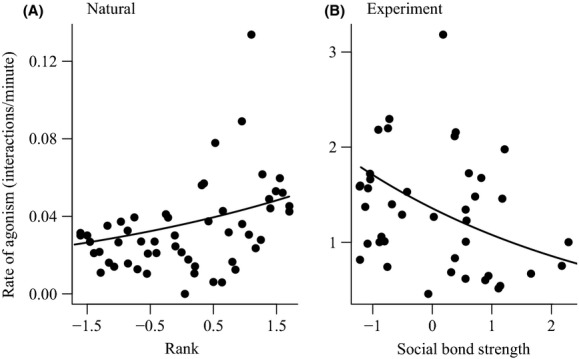
Figure 2.

The effect of individuals' rank in natural conditions (A) and social bond strength in experimental conditions (B) on the rate of agonism they experienced. In all plots, the points are median values for each individual (calculated from the repeated measures in the data for illustrative purposes) and the lines are the predicted relationships from each model (see Table2). Values on the x-axes were standardized to have a mean of zero and standard deviation of one before model fitting.
