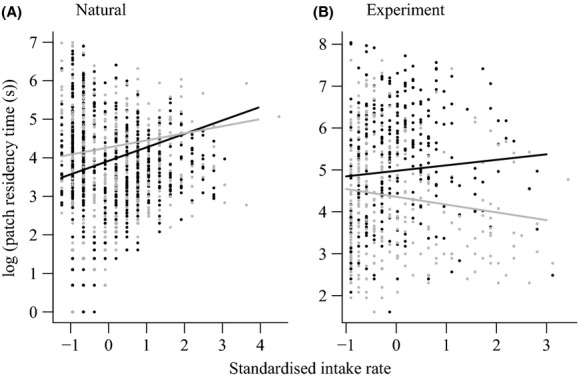
Figure 5.

The relationship between initial intake rate and patch residency time in (A) natural and (B) experimental foraging conditions. In both plots lines are the relationships estimated by the models (see Table5) and each point represents a patch visit. The data are split into individuals whose had higher (black) or lower (gray) social bond balance (A) and rank (B) than the median. Patch residency time are plotted on a natural log scale for ease of comparison, and intake rates were standardized to have a mean of zero and standard deviation of one before model fitting.
