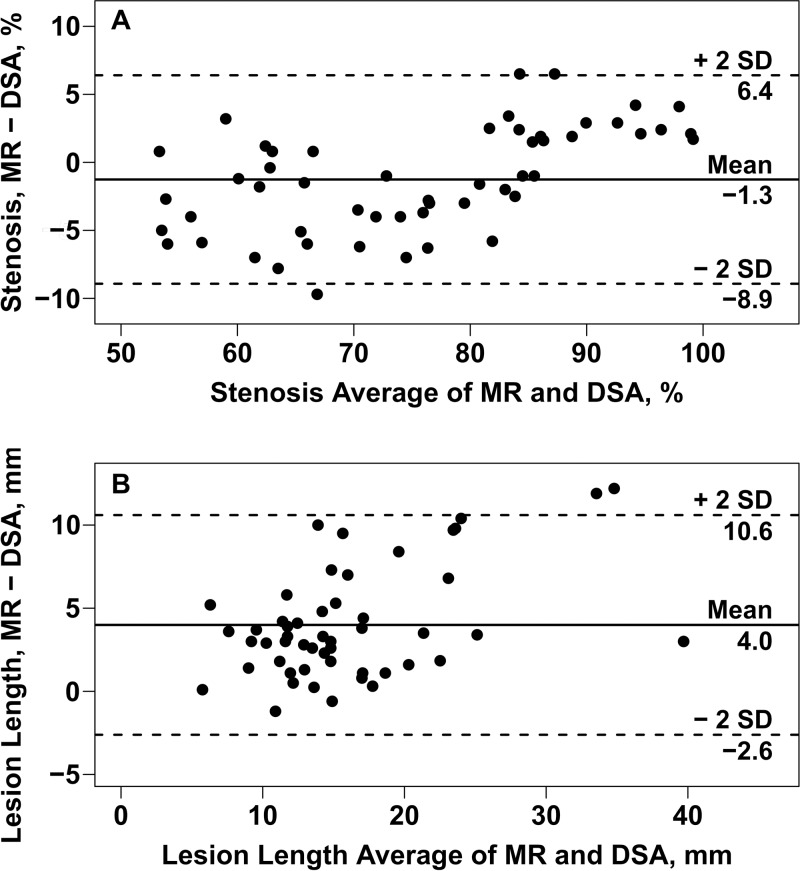
Figure 3:
Bland-Altman plots of, A, the difference in stenosis, and, B, lesion length measurements between MR reader 1 and DSA versus the means. Solid horizontal lines = mean differences (overall bias); dashed lines = 95% limits of agreement. There was a small but significant overall downward bias in the MR-based stenosis measurements (P = .007). The bias was −2.6% ± 0.4 (P < .001) when stenosis was less than 85% and 2.5% ± 0.4 (P < .001) when stenosis was greater than 85% (A).

