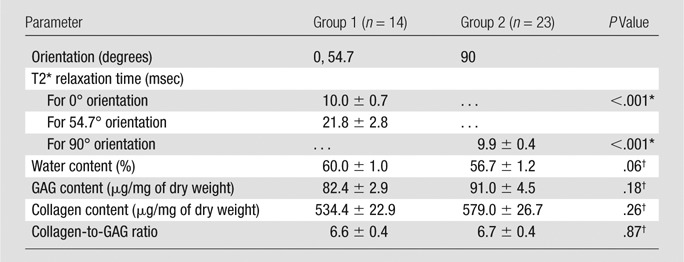
Mean T2* and Biochemical Compositions for Two Groups of Cartilaginous End Plates Imaged in Three Different Orientations

Note.—All data means ± standard error of the mean.
For comparison with 54.7° orientation
Group 1 versus group 2.
Mean T2* and Biochemical Compositions for Two Groups of Cartilaginous End Plates Imaged in Three Different Orientations

Note.—All data means ± standard error of the mean.
For comparison with 54.7° orientation
Group 1 versus group 2.