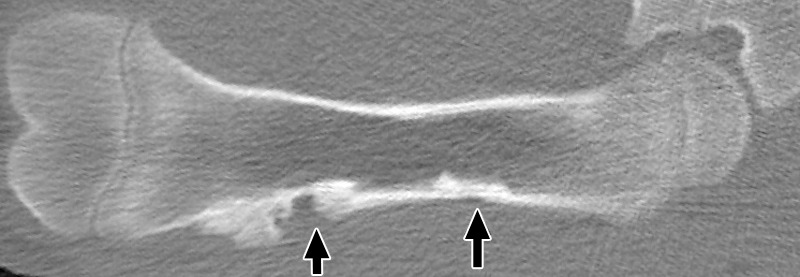
Figure 4b:

Coronal nonenhanced CT images in a treated femur (a) 3 weeks after MR imaging–guided HIFU ablation and (b) 6 weeks after ablation. At 3 weeks, both ablations show mixed endosteal sclerosis and lucency (arrows). Distal lesions also demonstrated a subtle focus of new bone density along the cortical margin. At 6 weeks, all ablations show dense subcortical sclerosis, but distal lesions also show a larger focus of new bone density along the cortical margin (arrows) compared with the appearance at 3 weeks.
