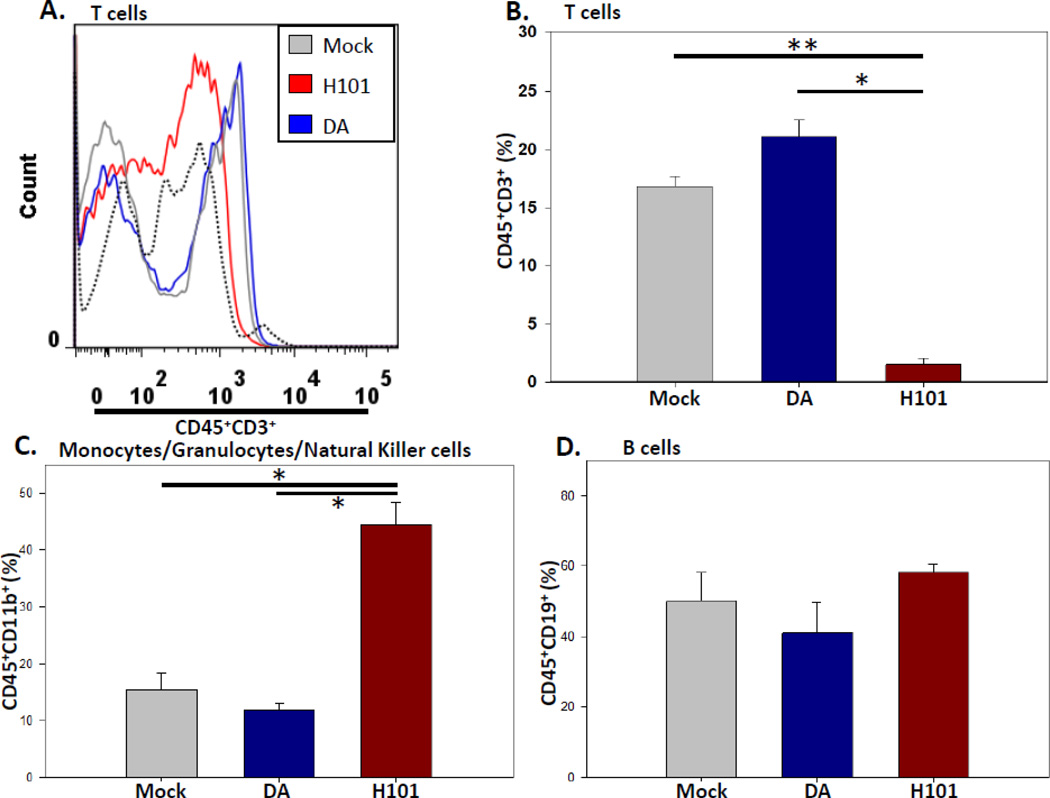
Figure 4.
H101 infection resulted in reduce T cells in the spleen. B6 mice were i.c. infected with 3 × 10⁵ pfu of DA or H101, or mock infected. Mouse spleens were collected on day 3 p.i. and analyzed by flow cytometry. (A) Representative flow cytometric histogram. Fluorescence minus one plus isotype antibody was used as a control (black dotted line). (B) Quantification of CD45+CD3+ T cells in the spleens. (C) Quantification of CD45+CD11b+
monocytes/granulocytes/natural killer cells in the spleens. (D) Quantification of CD45+CD19+ B cells in the spleens. Results represent the mean + SEM for groups of 4 mice per mock and DA groups and 5 mice per H101 group. *p<0.05, **p<0.005, Student’s t test.

