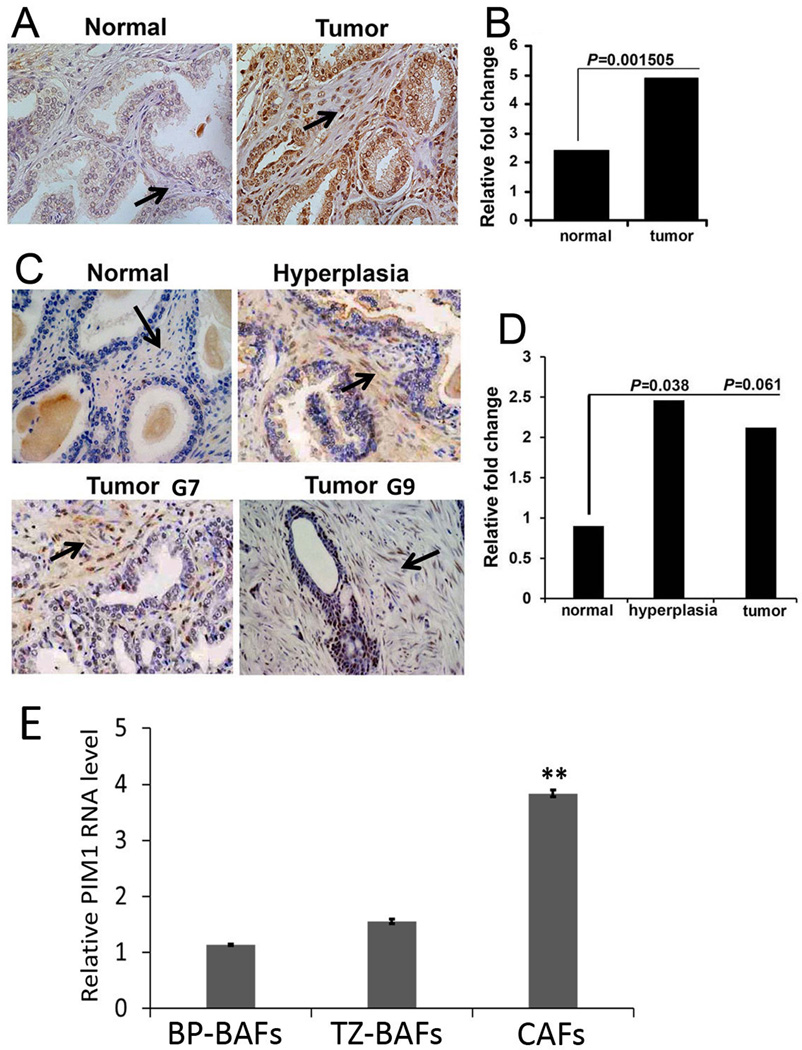
Figure 1. Expression of PIM1 in human prostate stroma.
(A) IHC staining of PIM1 using a prostate tissue microarray (TMA, MUSC). PIM1 expression is indicated in prostate stroma (arrows). (B) Semi-quantitative analysis of IHC. In blinded quantitative analysis of PIM1 immunostaining the percentage of PIM1 positive stromal cells was scored on a scale of 0–4, where 0=no positive cells, 1=1–25% positive cells, 2=26–50% positive cells, 3=51–75% positive cells, and 4=76–100% positive cells. The intensity of staining was scored on a scale of 0–3, where 0=negative, 1=mild, 2=moderate, and 3=intensive staining. A final score was calculated by multiplying the percentage and intensity scores. P values were calculated by t test and represent the probability of no difference between PIM1 positive cells in the stroma of normal and cancer tissues. (C) IHC staining of PIM1 using a TMA (Folio Bioscience). PIM1 expression is indicated in both the hyperplastic and cancer stroma (arrows; G7; G9- Gleason score 7 and 9 accordingly). (D) Semi-quantitative analysis of IHC. Percentage of PIM1 positive stromal cells was scored as described above. (E) qRT-PCR analysis of pooled RNA samples obtained from primary CAFs and BAFs. Each value represents the mean ± SD of six pooled measurements produced from two independent experiments. **, P < 0.001; P values were calculated by t tests and represent the probability of no difference between PIM1 mRNA levels in BAFs and CAFs.

