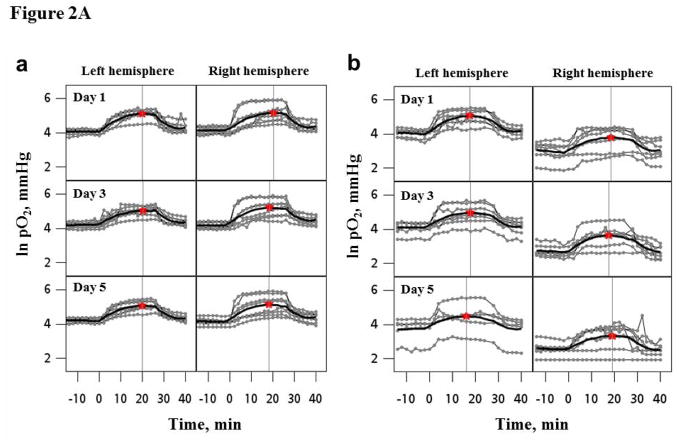
Figure 2.
Figure 2A. Temporal changes in the pO2 of left and right hemisphere of (a) normal mice (n = 8) and (b) mice bearing U251 glioma in the right hemisphere (n=6) during 30% O2, carbogen and 30% O2 breathing. The experiment was repeated for five consecutive days. The bold lines are the mean response in the group obtained using an exponential quadratic function. The star symbol and horizontal line indicates the maximal pO2 and time to reach maximal pO2 on each day, respectively.
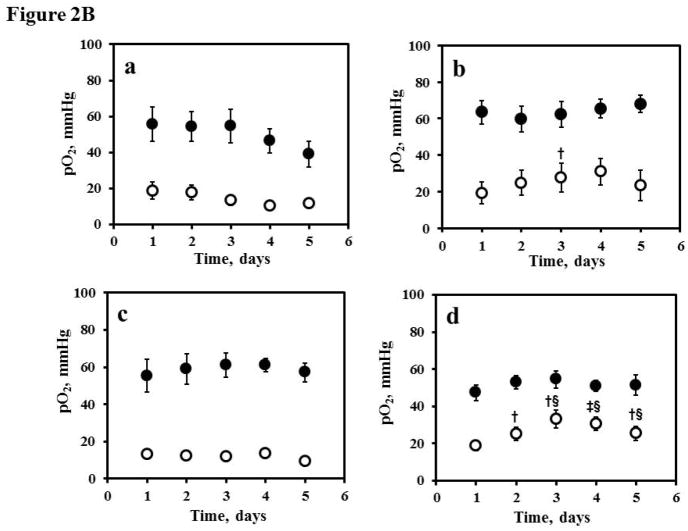
Figure 2B. Tissue pO2 of the contralateral brain (●: CLB) and ipsilateral glioma (
 : U251) in the (a) control (vehicle, n = 5); (b) gemcitabine (150 mg/kg, n = 5); (c) MK-8776 (50 mg/kg, n = 6), and (d) gemcitabine (150mg/kg) + MK-8776 (50 mg/kg) at 18 h (n = 8) measured using EPR oximetry with implantable resonator for five consecutive days. The mice were treated on day 1 after baseline pO2 measurement. †p<0.05, ‡p<0.01, compared with day 1; §p<0.01, compared with control group at the same day.


