Figure 3.
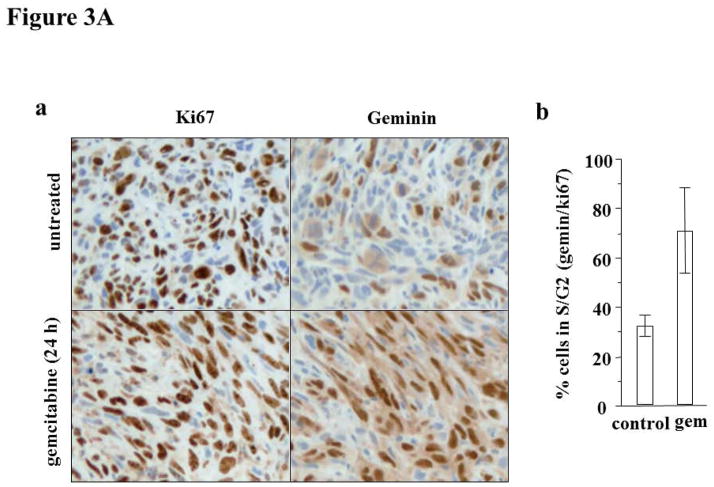
Figure 3A. (a) Geminin and Ki67 immunohistochemistry images of the control and glioma treated with gemcitabine. (b) The results expressed as the % geminin positive/%Ki67 positive; n = 2–4 (Mean ± SD).
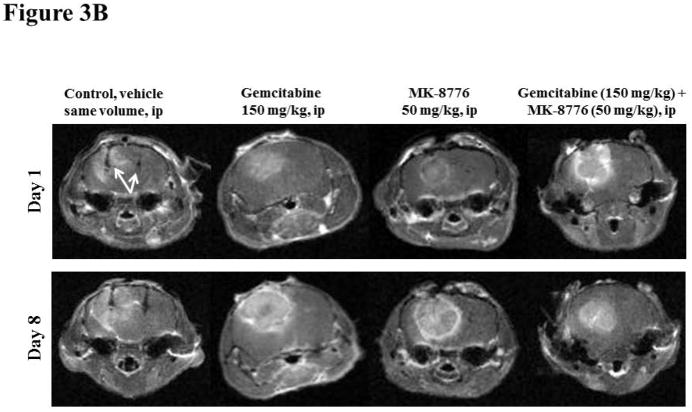
Figure 3B. Typical diffusion images used to assess volume and apparent diffusion coefficient of water (ADC) of orthotropic U251 glioma on days 1 and 8 in the control, gemcitabine, MK-8776 and gemcitabine + MK-8776 groups by MRI. The implantable resonators are visible in the images of the control group (indicated by arrows).


