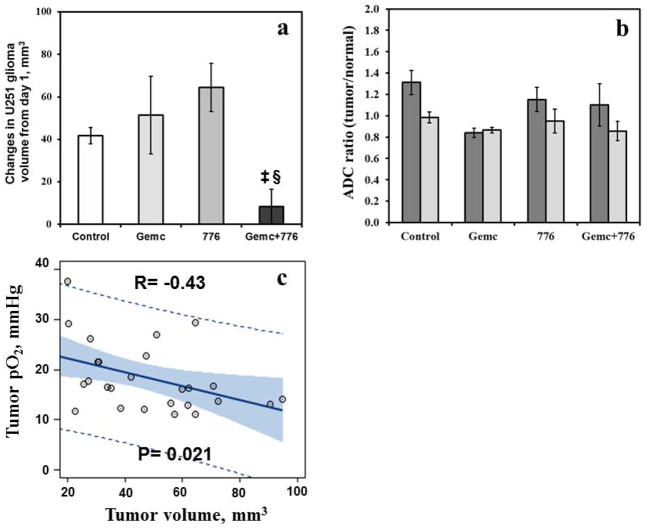
Figure 4.
(a) Relative change in U251 glioma volume (day 8 - day 1, mm3) and (b) ADC ratio (tumor/normal) in the control, gemcitabine, MK-8776 and gemcitabine + MK-8776 groups. ‡p < 0.01, compared with day 1; §p < 0.01, compared with control group. (c) U251 glioma pO2 vs volume on day 1. Dash lines indicate 95% prediction limits, bold line indicates the fit and grey area indicates confidence limits.

