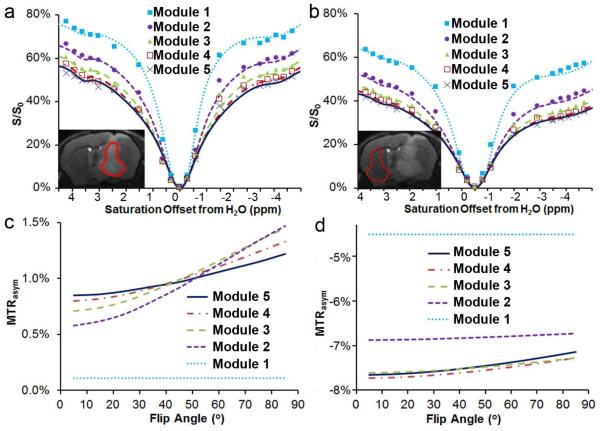
Figure 4.
In vivo experimental Z-spectra (symbols) and 4-pool Bloch equation simulations using MeLOVARS (lines) of tumor (a) and contralateral WM (b), with the experimental DF reaching ~10 % for θ = 25°, N = 5 compared to the conventional acquisition method with the same tsat ; Plot of simulations using the same parameters to determine how MTRasym changes as a function of FA (θ) for tumor (c) and contraleral WM (d). The fit parameters were: bulk water pool: T1_tumor = 2.35 s, T1_WM = 2.0 s, T2_tumor = 35 ms, T2_WM = 26 ms; macromolecular pool: T2 = 0.0078 ms, ksw = 159 s−1, conc._tumor = 4598 mM, conc._WM = 9800 mM; exchangeable amide pool: T2 = 6 ms, ksw = 20 s−1, conc._tumor = 629 mM, conc._WM = 290 mM; and aliphatic pool: T2 = 2.7 ms, ksw=10.5 s−1, conc._tumor = 1100 mM, conc._WM = 2900 mM. The T1 values for the other 3 pools were set to be the same as bulk water.

