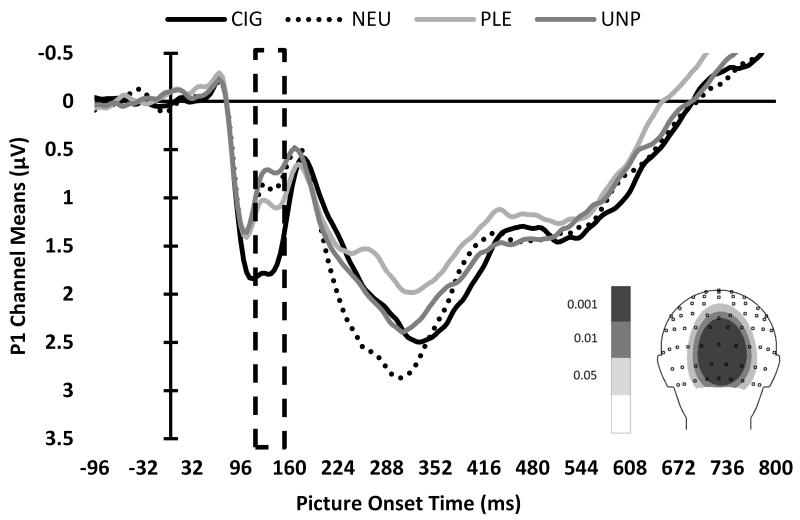
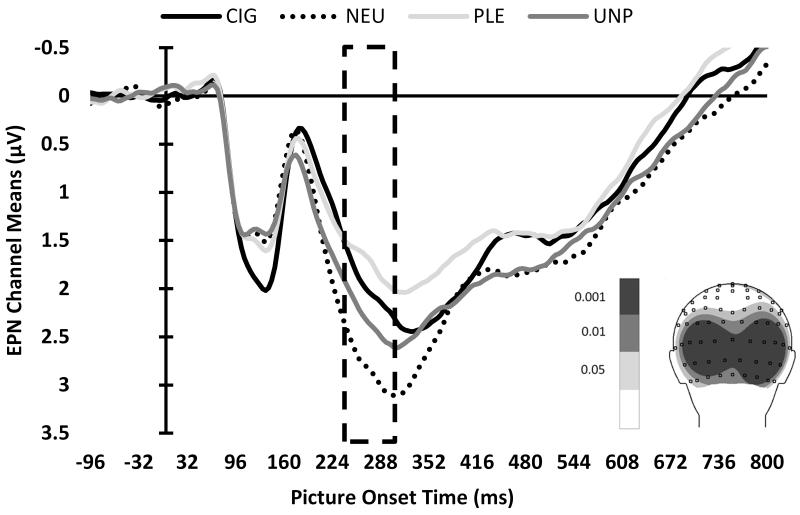
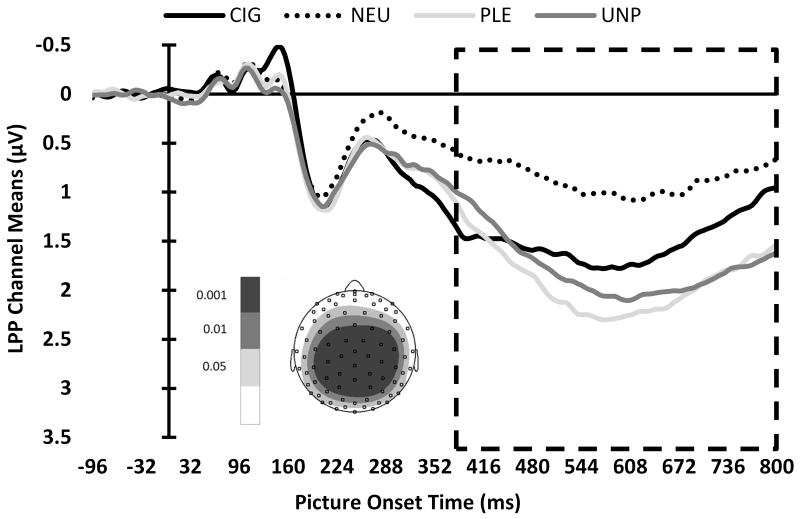
Figure 2.
ERP waveforms of mean channel ROIs, by picture type, for the (A) P1, (B) EPN, and (C) LPP components. The boxes indicate the time ROIs for each component. Inset: Topographic distributions of the F values to visualize which channels showed significant differences for each component. Channels that exceeded the 99.9th percentile permutation F threshold, indicated by the darkest shading, were included in subsequent analyses.


