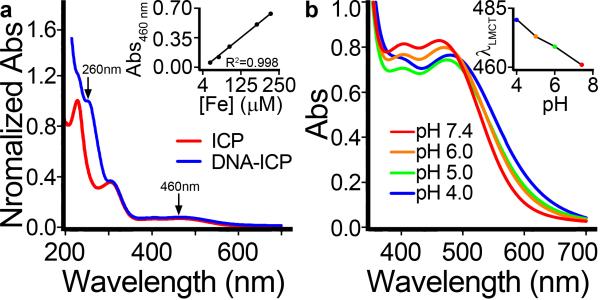
Figure 2.
UV-Vis analysis of DNA-ICP particles. a) Comparison of bare ICP particles with DNA-ICP particles showing the DNA absorbance at 260 nm. Inset: determination of LMCT ε460. b) pH dependence of LMCT absorbance. The red-shift of λmax with decreasing pH is indicative of complex dissociation (see inset).

