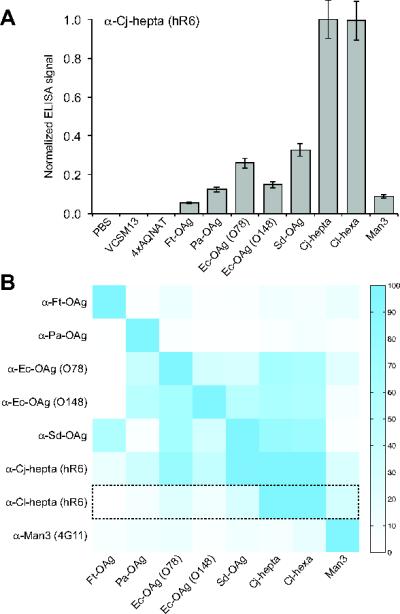
Figure 3. Glycan-protein interactions detected by glycophage ELISA.

(A) Representative ELISA results obtained by immobilizing glycophage preparations on microtiter plate surfaces. Glycophage preparations were prepared from E. coli TG1 ΔwaaL cells co-transformed with the phagemid pBAD-MBP4xDQNAT-CT::PglB and one of the 8 different glycan encoding plasmids. Controls included PBS, helper phage only (VCSM13), and phages prepared from E. coli TG1 ΔwaaL cells co-transformed with pBAD-MBP4xAQNAT-CT::PglB and pMW07pglΔB (4xAQNAT). All samples were immobilized in triplicate and probed with hR6 serum antibodies (α-Cj-hepta). ELISA signals (Abs492) for each sample were normalized to the signal measured for the Cjhepta N-glycan sample. The results are reported as the average normalized ELISA signal (n=3) and error bars represent the standard deviation of the mean. (B) Orthogonality matrix depicting glycan specificity profiles for different GBPs. Glycophage ELISA was performed whereby each GBP (y-axis) was probed against the glycan library (x-axis) identically as described in (A) for hR6 serum antibodies. Each row depicts the normalized ELISA signals measured for the indicated GBP against each glycan sample, where data was independently normalized to the maximum signal obtained for that GBP. Color intensity scale is shown at right (highest signal = blue; lowest signal = white). Dashed box corresponds to data from (A) for hR6 serum antibodies.
