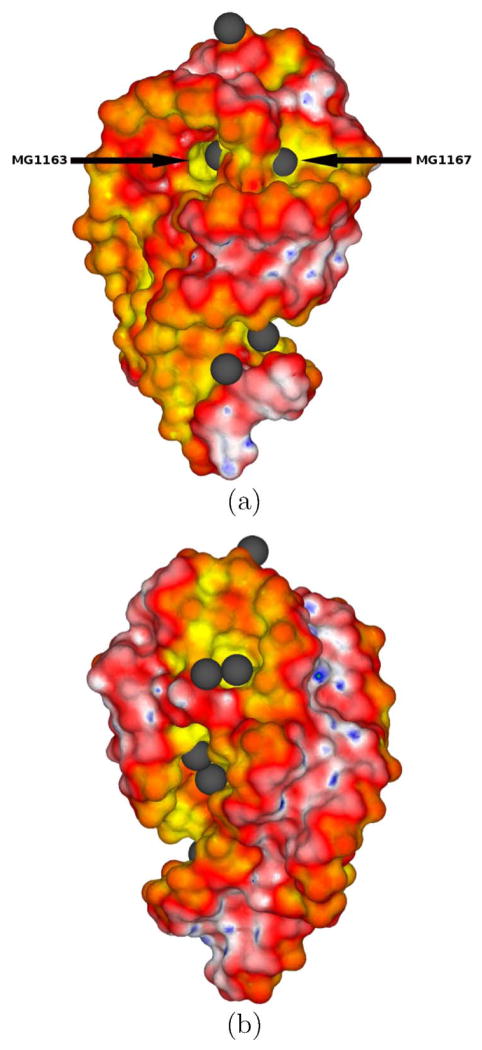
Figure 6.
Two views of the electrostatic potential (ϕ) surface map of the rRNA (PDBid: 1HC8) obtained with the nonlinear Poisson-Boltzmann equation and a finest grid spacing of 0.1 Å. The ϕ scale is as follows: (G,B,W,R,Y) = (5.5,2.75,0, −2.75, −5.5) kT/e. The Mg2+ binding sites are displayed as gray spheres. Panel (a) highlights the two Mg2+-binding sites (MG1163 and MG1167) with the largest negative ϕ’s.

