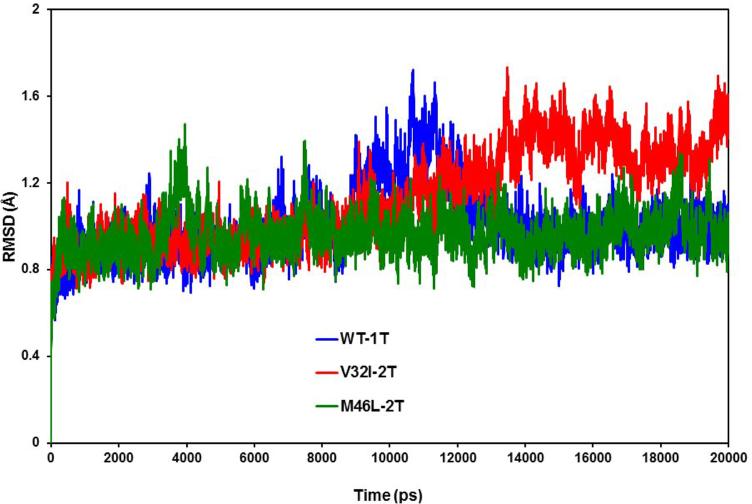
Figure 4.
Root-mean-square-displacement (RMSD) plot for backbone Cα atoms relative to their initial minimized complex structures as a function of time. The plot shows the RMSD of Cα atoms for the singly bound TMC114 to the active site region of the HIV-1 protease (WT-1T) and doubly bound TMC114 to the active site and flap region of HIV-1 protease mutants (V32I-2T and M46L-2T).

