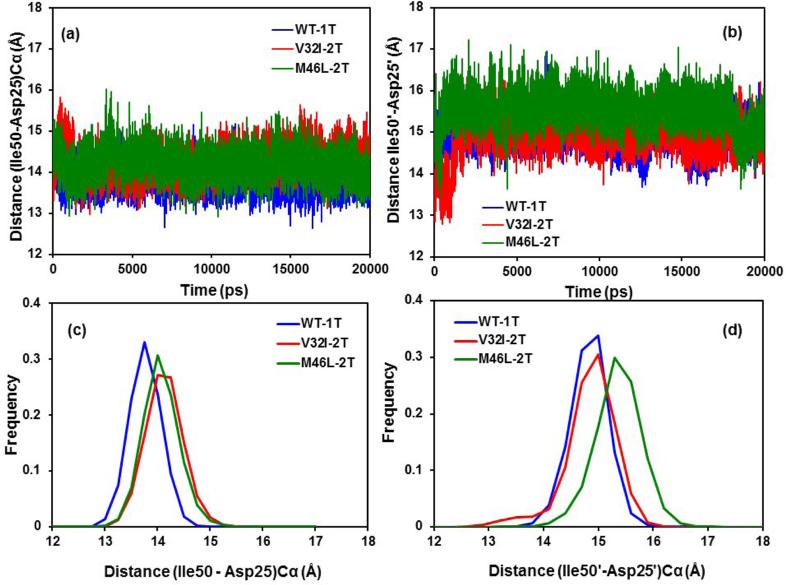
Figure 6.
Time series plot of (a) the Ile50-Asp25 Cα distances, (b) the Ile50’-Asp25’ Cα distances of the WT-1T, V32I-2T mutant and M46L-2T mutant HIV-1-pr. (c) Histogram distributions of Ile50-Asp25 distance; and (d) histogram distributions of Ile50’-Asp25’ distance for WT-1T, V32I-2T mutant and M46L mutant HIV-1-pr simulation.

