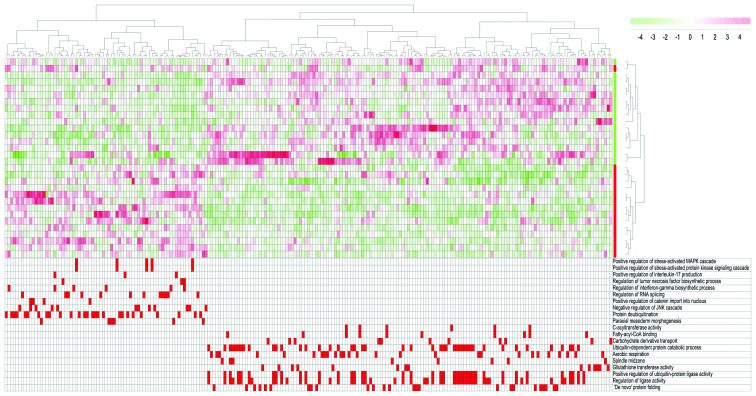
Figure 5.
Hierarchical clustering based on gene set enrichment analysis for patients with a high Cx45 mRNA expression. We used global gene expression analyses of the acute myeloid leukemia (AML) cells for 48 consecutive patients (cohort 2), and we compared the 15 patients with highest GJC1 expression (red column bar) and the 15 patients with the lowest GJC1 expression (green column bar). We performed a gene set enrichment analysis (GSEA), comparing the two distinct groups. By using the leading genes belonging to the top ten gene ontology (GO) terms enriched in both the low and high groups, we were able to 225 genes enriched in at least one GO term. These genes were used to perform a hierarchical clustering analysis, dividing the two groups in two distinct clusters, except one outlier. The heatmap shows downregulated genes (green) and upregulated genes (red); the GO terms in which the marked genes belonged to are in the bottom of the figure.

