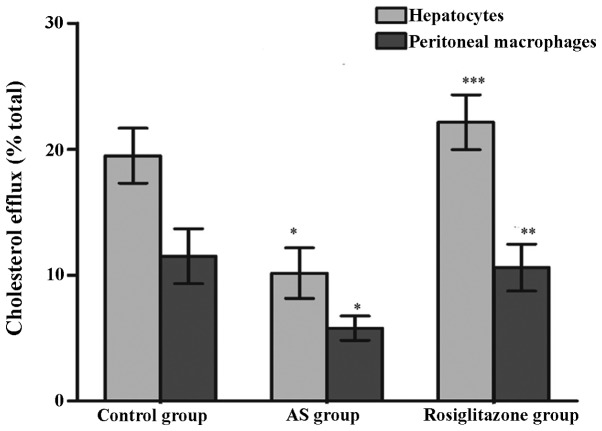
Figure 2.
Comparison of HDL-induced cholesterol efflux rates from hepatocytes and peritoneal macrophages among the 3 groups. Data are presented as the means ± SEM, (n=6 in each group). *P<0.01, vs. control group; **P<0.01, ***P<0. 05, vs. AS group (ANOVA). HDL, high-density lipoprotein; AS, atherosclerosis.

