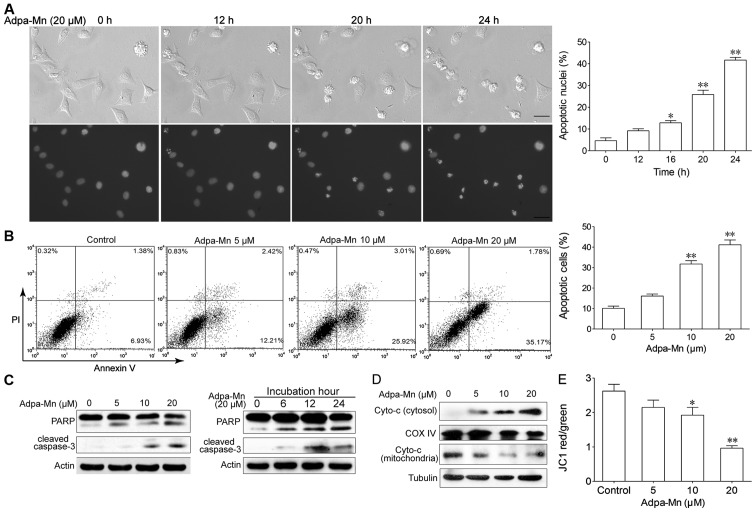
Figure 3.
(Adpa-Mn induces apoptotic cell death. (A) H2B-GFP-labeled HeLa cells (stable cell line) were treated with Adpa-Man (20 μM) for 24 h, morphology and nuclei were photographed using a Nikon TE2000 microscope with a live cell system. Apoptotic nuclei were counted in 10 fields of vision at each time point and the apoptotic percentage was calculated. Scale bar, 5 μm. (B) HepG2 cells treated with Adpa-Mn were collected and subjected to Annexin V/propidium iodide (PI) staining. (C) PARP and caspase-3 activation were assessed by western blot analysis. (D) The release level of cytochrome c from the mitochondria was examined by western blot analyiss. (E) HepG2 cells treated with Adpa-Mn were collected and subjected to mitochondrial membrane potential analysis. Data represent the means ± SD of 3 different experiments. *p<0.05 and **p<0.01, as compared with the untreated (control) group.

