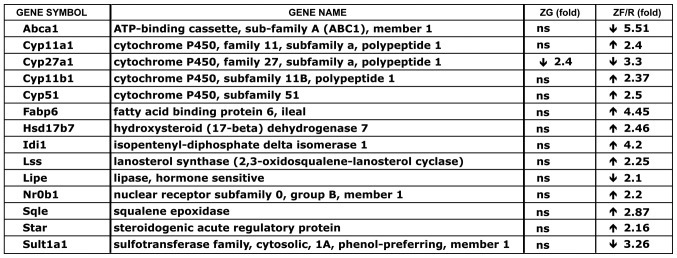
Figure 6.

List of genes represented in ZF/R cluster 1, subcluster ‘steroid metabolic process’ (shown in Table II, DAVID analysis) and which are differentially expressed in the ZG and ZF/R of adrenal glands of adult female rats, in comparison to adult male rats. Downward facing arrowhead indicates a lower expression in females than in males; upward-facing arrowhead indicates a higher expression in females than in males; ns, differences statistically not significant; ZG, zona glomerulosa; ZF/R, zona fasciculata/reticularis.
