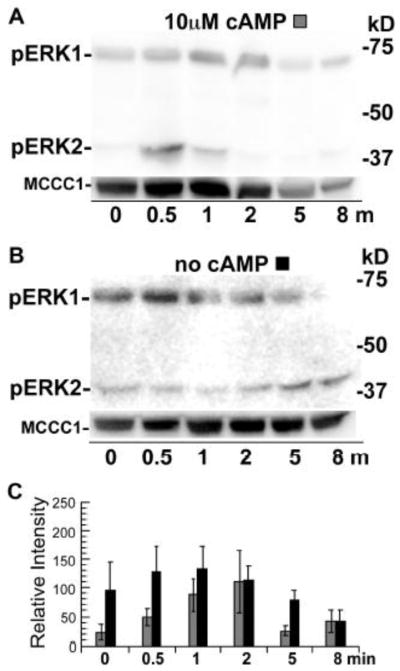
Figure 2.

Phosphorylation of ERKs in wild-type cells treated with cAMP and vortexing. Cells were starved for 5 hours in shaking cultures and pulsed with cAMP for the last 2 hours to induce cAMP responsiveness as described in the Materials and methods section. Cells were harvested at times indicated after repeated vortexing with or without cAMP stimulation and then the resulting extracts were subjected to immunoblot analysis. Upper panels are immunoblots using the anti-phospho-MAPK antibody and lower panels are immunoblots that detect the loading control protein MCCC1. Each lane contained extracts from approximately 1 × 10⁶ cells. Exposure times varied for the chemiluminescent detection of different blots. (A) Cells were treated with 10 μM cAMP and repeated vortexing. (B) Cells were vortexed repeatedly without cAMP treatment. (C) Graph of the mean pixel intensity of the phosphorylated ERK1 bands of three immunoblots of multiple experiments. Gray and black shaded columns correspond to treatments (A) and (B), respectively. Error bars represent the standard deviation.
