
Figure 5.
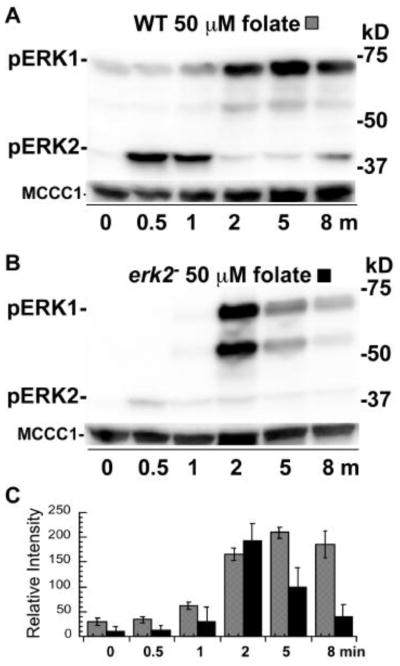
Phosphorylation of ERKs in wild-type and erk2− cells stimulated with folate. Cells were starved in phosphate buffer for 1 hour and folate stimulation was conducted while cells were continuously shaken at 200 rpm in conical tubes (no vortexing). (A) Wild-type cells stimulated with 50 μM folate. (B) erk2− cells stimulated with 50 μM folate. (C) Graph of the mean pixel intensity of the phosphorylated ERK1 bands of three immunoblots of multiple experiments. Gray and black shaded columns correspond to treatments (A) and (B), respectively. Error bars represent the standard deviation.