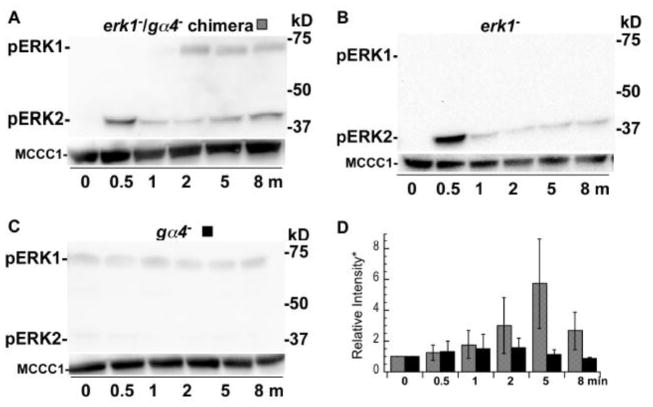
Figure 6.
Phosphorylation of ERKs in erk1−, gα4− chimeric and clonal cell populations stimulated with folate. Cells were prepared and stimulated with folate as described in figure 5. (A) Chimeric population of erk1− and gα4− cells mixed in a 1:1 ratio and stimulated with 50 μM folate. (B) erk1− cells only stimulated with 50 μM folate. (C) gα4− cell only stimulated with 50 μM folate. (D) Graph of the mean pixel intensity of the phosphorylated ERK1 bands of three or more immunoblots of multiple experiments (*values have been normalized to the 0 min time mean intensity). Gray and black shaded columns correspond to treatments (A) and (C), respectively. Error bars represent the standard deviation.

