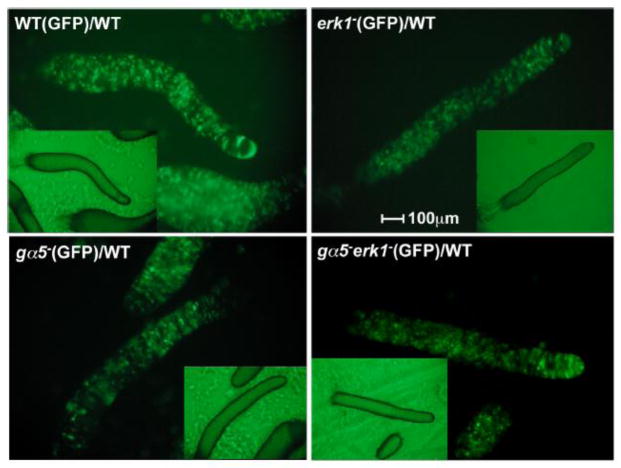
Figure 8.
Spatial distribution of erk1− and gα5− mutants in chimeras with wild-type cells. Wild-type (WT), erk1−, gα5−, and gα5−erk1− cells were labeled with a GFP expression vector and mixed with an excess of unlabeled wild-type cells (1:10 ratio) before plating for development. GFP fluorescence in migratory slugs was recorded at 16 h of development. Insets show brightfield images (2 fold size reduction). The central slug in each image is positioned with the anterior on the right side of the image.

