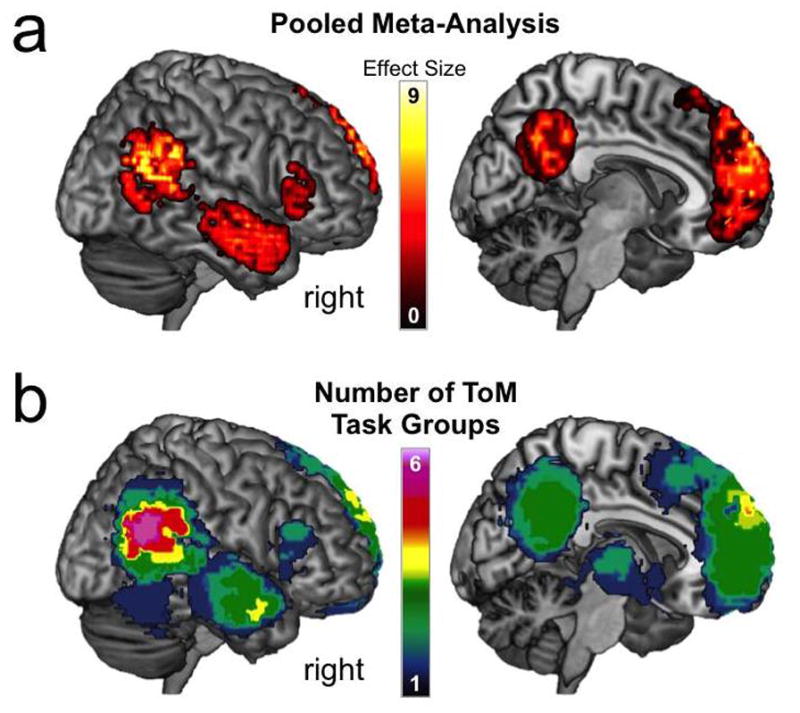
Figure 2.

Deconstructing the ToM Network. Data is adapted from meta-analytic results reported in [29], which included 73 neuroimaging studies that used one of the six distinct task groups listed in Box 1 and are rendered on a canonical brain in Montreal Neurological Institute (MNI) space. (a) Results of the meta-analysis when pooling data from all six distinct task groups. (b) Sum of results from six independent meta-analyses conducted for each task group. The color map indexes the number of the tasks that reliably produce activation at a given voxel.
