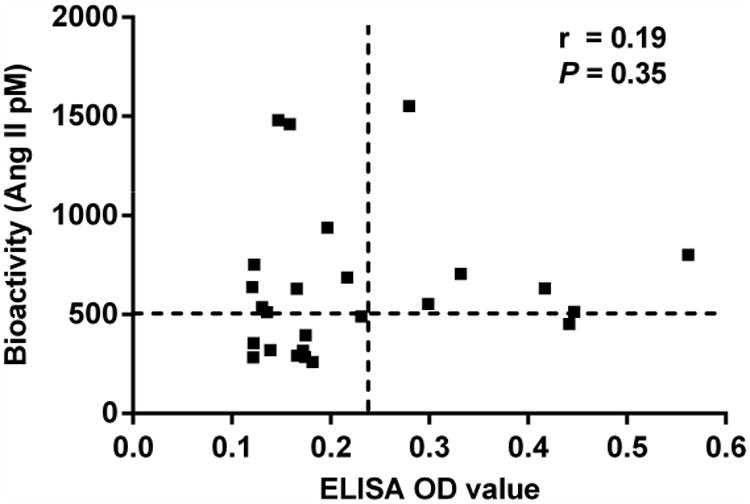
Figure 4. Correlation analysis between ELISA and cell-based bioassay for AT1R autoantibodies.

The vertical and horizontal dashed lines represent the cut-off values (mean + 2SD of controls) for ELISA and bioassay positivity, respectively. No significant correlation was detected between ELISA OD values and bioactivity values.
