
Figure 7.
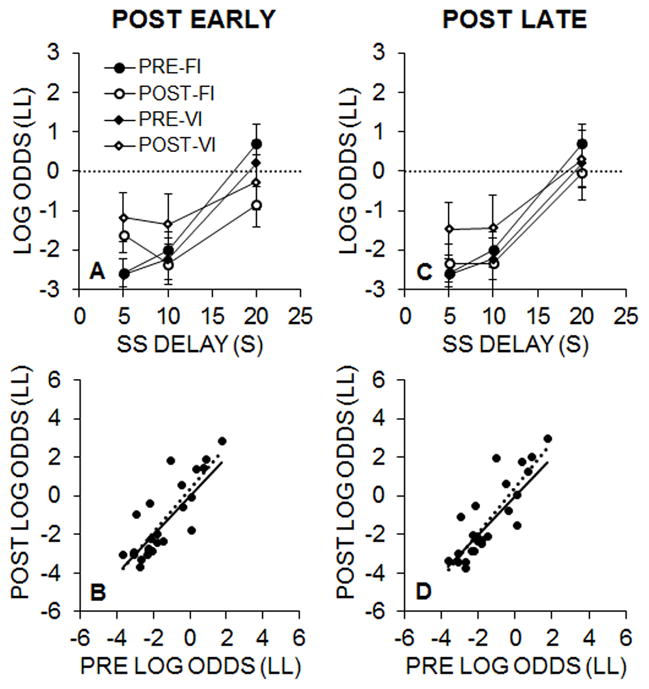
A: Experiment 3 mean (± SEM) log odds of LL choices for Groups FI and VI during the pre- and early post-intervention impulsive choice tasks. B: Log odds of LL choices in the pre- versus early post-intervention tests for individual rats. The dashed line is the best fitting regression line through the data and the solid line represents the unity relationship as a comparison. C: Mean (± SEM) log odds of LL choices in the pre- and late post-intervention impulsive choice tasks. D: Log odds of LL choices in the pre- versus late post-intervention tests.