Figure 6.
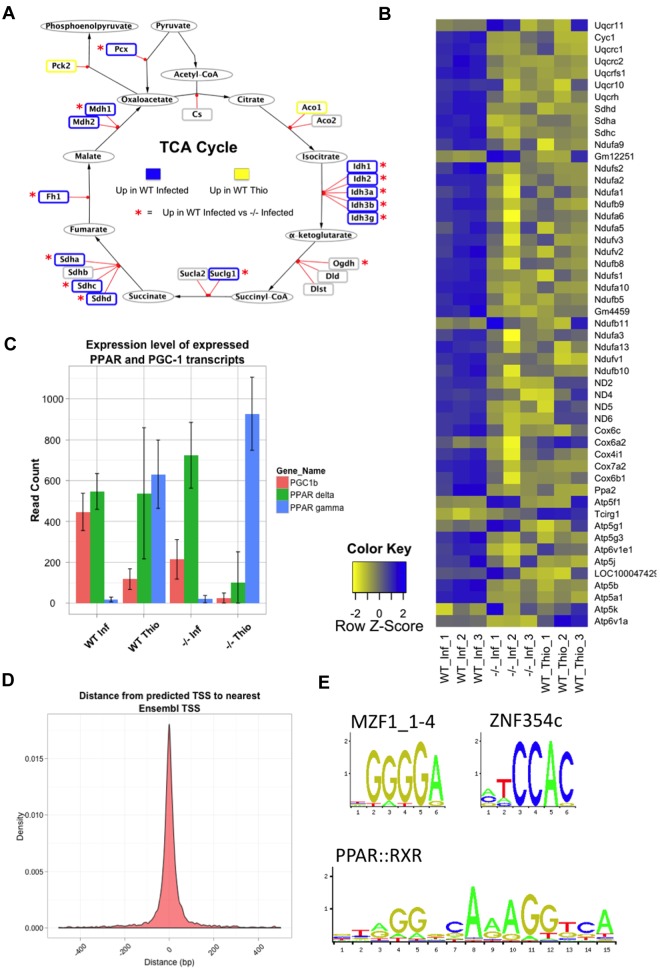
AAMφ up-regulate mitochondrial TCA cycle genes and show evidence of PPAR-dependent transcription in vivo. (A) Schematic of the TCA cycle showing DE genes in WT-NeMφ relative to WT-ThioMφ. Blue border represents up-regulated; and yellow border, down-regulated. In addition, a red asterisk indicates genes up-regulated in WT-NeMφ relative to IL4Rα−/−-NeMφ. (B) Heatmap showing relative expression of mitochondrial electron transport chain (ETC) components between WT-NeMφ, IL4Rα−/−-NeMφ, and WT-ThioMφ. The majority of ETC components are most highly expressed in WT-NeMφ. (C) The expression levels of transcripts encoding for PPARγ, PPARδ, and the coactivator protein PGC-1β show that WT-NeMφ express high levels of PPARδ and PGC-1β, but not PPARγ. (D) Confirmation of the accuracy of TSS prediction. The density plot shows the distances from the predicted TSS for each gene to the nearest annoated Ensembl TSS (median absolute deviation = 32 bp). (E) Consensus motifs for the 3 over-represented transcription factor binding sites in AAMφ-associated promoter regions identified using Clover (P < .01), comparison of AAMφ-associated promoter regions (TSS −400, +100 bp) against non-AAMφ-associated macrophage promoters.

