
Figure 5.
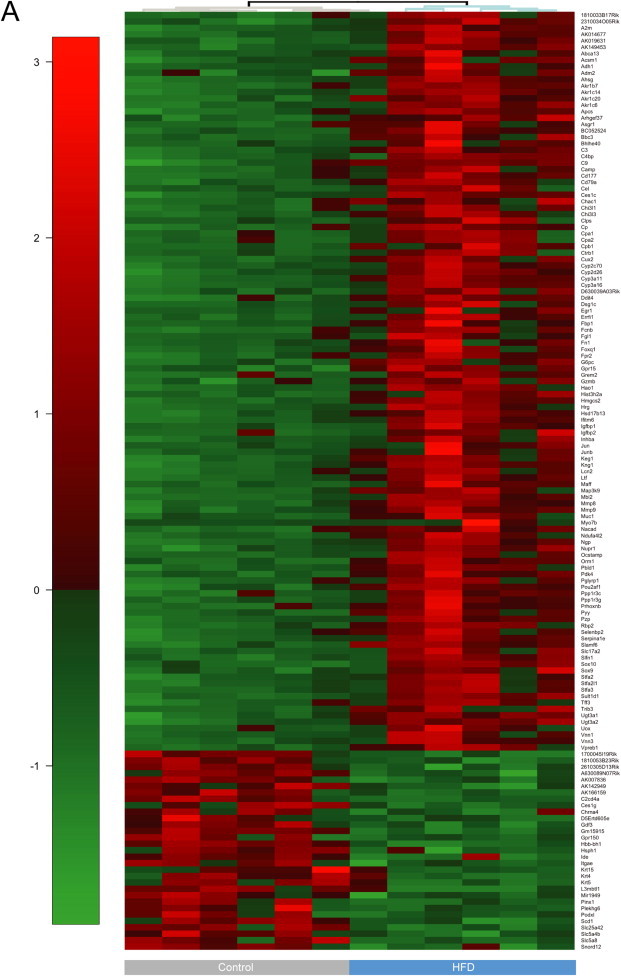
Differential expression of transcripts in HFD versus control fetal livers. (A) Heatmap visualization of differentially expressed* (DE) transcripts between high-fat and control diet programmed, male, 15 ± 0.5 dpc fetal liver cells, as analyzed by RNA-seq. Transcripts with significant fold changes, based on both fold change and FDR adjusted P-value threshold, are shown in the heat map. Gene names are indicated to the right of the heat map and cohort is shown at the bottom. Red = upregulation, green = downregulation. Dendrogram indicates sample clustering. *DE genes defined as having an FC >1.5 and FDR <0.05 in both the common and tagwise dispersion estimate analysis.