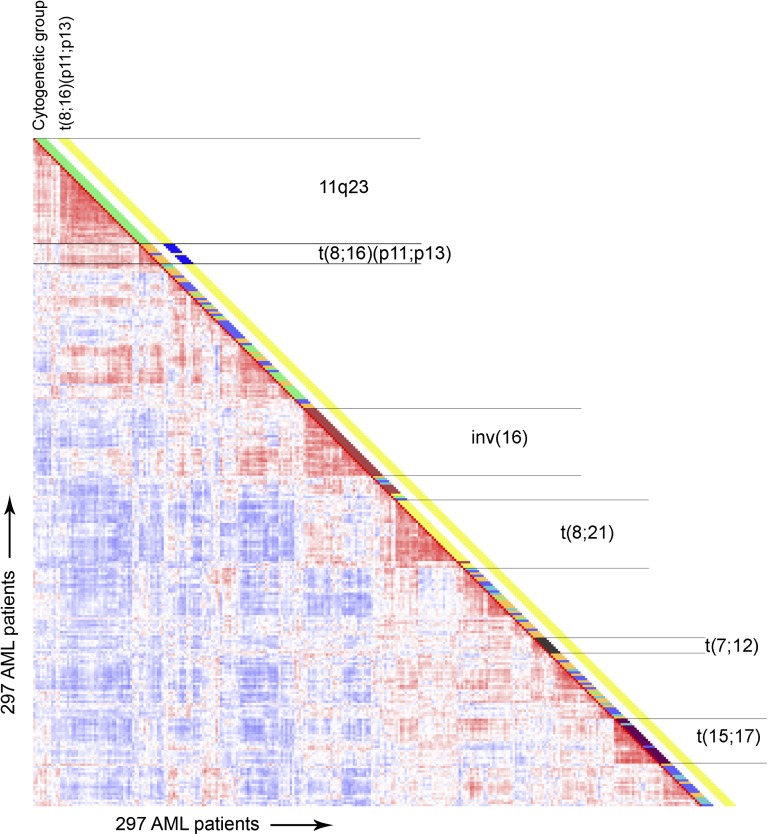
Figure 3.
Unsupervised clustering of the gene expression profiles of 297 pediatric AML patients. Pairwise correlations between 297 samples of pediatric patients with acute myeloid leukemia. The cells in the visualization are colored by Pearson's correlation coefficient values with deeper colors indicating higher positive (red) or negative (blue) correlations. Cytogenetic data are depicted in the columns along the original diagonal of the heatmap. Cytogenetic group classification is depicted in the first column (MLL-rearranged-green, inv(16)-red, t(8;21)-yellow, t(15;17)-purple, t(7;12)-brown, cytogenetically normal-blue, other-orange, unknown-aqua). Presence of t(8;16)(p11;p13) is depicted in the second column (t(8;16)-blue, no t(8;16)-yellow).

