
Figure 1.
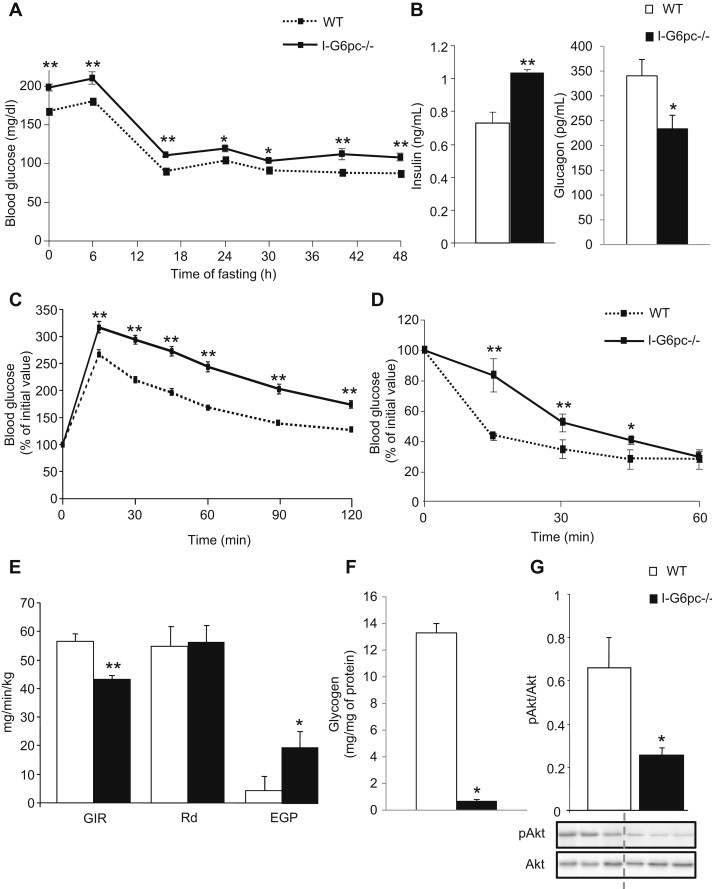
Alteration of glucose control in I-G6pc−/− mice. (A) Plasma glucose concentration monitored throughout fasting in I-G6pc−/− and WT mice (means ± SEM, n = 6). (B) Plasma insulin and glucagon levels at 6 h fasting. (C) Glucose tolerance test in I-G6pc−/− and WT mice. The data are expressed as % of initial plasma glucose (means ± SEM, n = 8). (D) Insulin tolerance test in I-G6pc−/− and WT mice. Expression of data as in panel c (means ± SEM, n = 10). (E) Insulin sensitivity assessed by hyperinsulinemic-euglycemic clamp (means ± SEM, n = 5). (F) Hepatic glycogen stores measured at the end of the clamp. (G) Phosphorylation state of Akt studied in the fed state (means ± SEM, n = 5). *p < 0.05; **p < 0.01 vs WT mice.