
Figure 5.
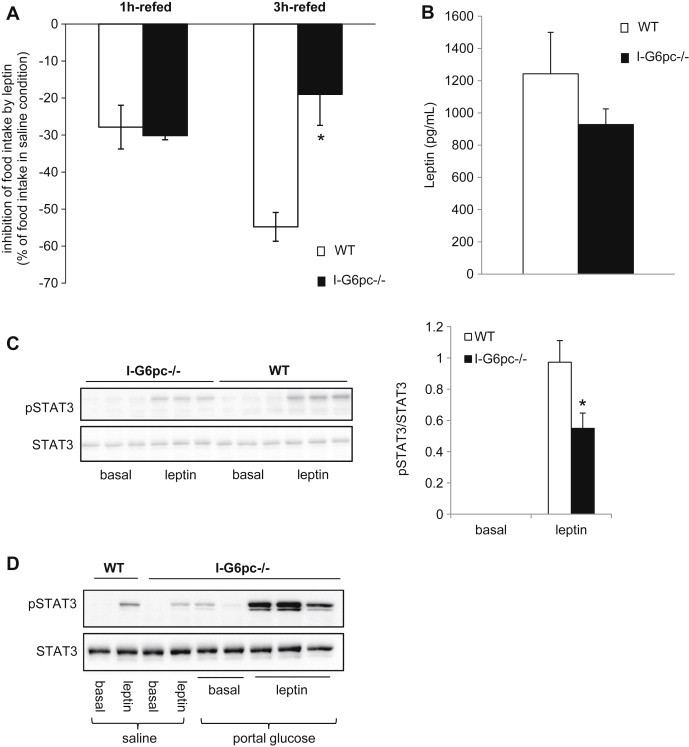
Alteration of hypothalamic leptin sensitivity in the absence of IGN (A) Leptin tolerance studied at 16 h fasting from a fast-refed paradigm in I-G6pc−/− and WT mice (means ± SEM, n = 10, *p < 0.05). The data are expressed as % of food intake in saline condition. (B) Plasma leptin level in the fed state (means ± SEM, n = 7–8). (C) Phosphorylation state of STAT3 in the hypothalamus measured after IP injection of leptin. The graph shows the quantification of phosphorylation state of STAT3 (means ± SEM, n = 5, *p < 0.05). (D) Activation of STAT3 phosphorylation in the hypothalamus by IP injection of leptin after saline or glucose infusion in the portal vein.