
Figure 6.
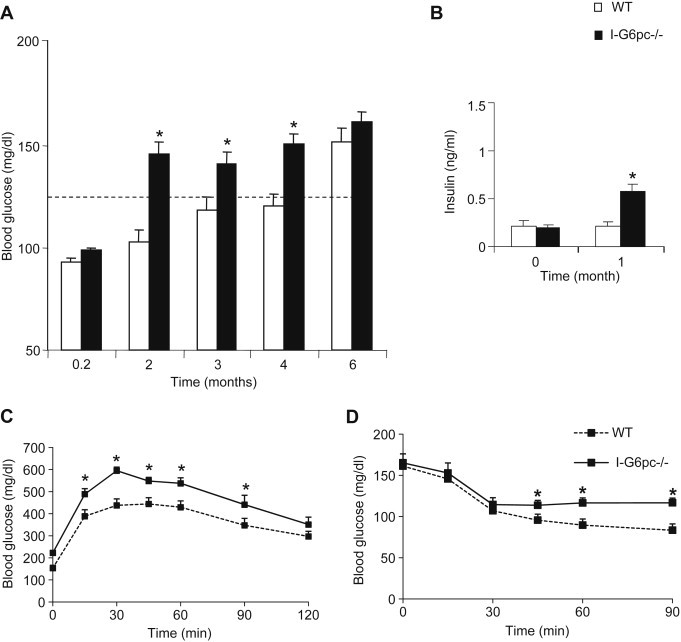
Proneness of I-G6pc−/− mice to the development of T2D induced by a HF-HS diet. (A) Fasting blood glucose concentration monitored through time in I-G6pc−/− and WT mice. The body weight was 51.9 ± 1.6 g and 52.5 ± 1.3 g in WT and I-G6pc−/− mice, respectively, after 6 months on the HF-HS diet. (B) Plasma insulin levels at 6 h fasting. (C) Glucose tolerance in I-G6pc−/− and WT mice. (D) Insulin tolerance in I-G6pc−/− and WT mice (means ± SEM, n = 10; *p < 0.05 vs WT mice).