
Figure 5.
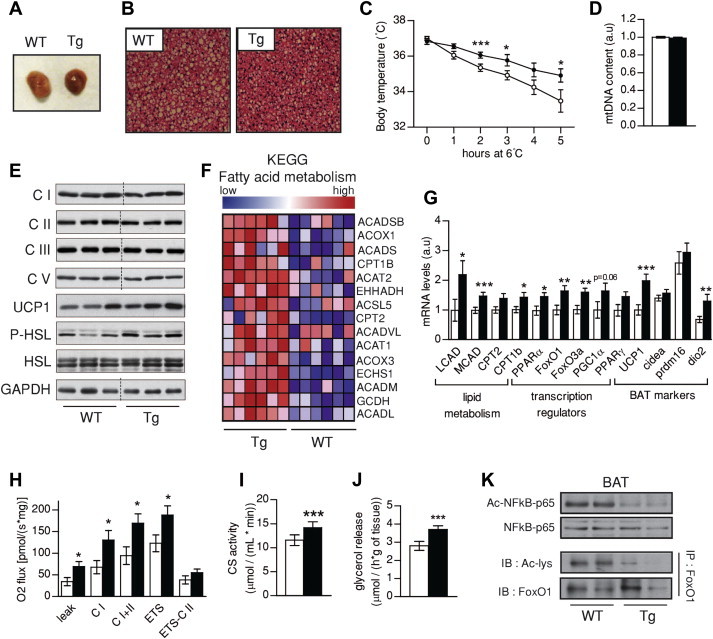
Brown adipose function is improved in SIRT1 transgenic mice. (A) Pictures of brown adipose tissue (BAT) from WT and Tg mice. (B) Hematoxylin and eosin stainings on the BAT of wild type (WT) and SIRT1Tg/Tg (Tg) mice (bar = 600 μm) (C) Brown adipose thermogenic function was evaluated by placing WT and Tg mice at 6 °C for 5 h. (D) Mitochondrial DNA content in BAT from WT and Tg mice, normalized to nuclear DNA copy number. (E) Western Blots were performed to evaluate the protein levels of proteins in BAT from WT and Tg mice (thin black lines on gels are used for lanes that were run on the same gel but were non-contiguous). (F) Gene set enrichment analyses of gene expression profiles of BAT from WT and Tg mice. (G) Total mRNA was extracted from BAT and used for qPCR analysis. (H) Oxidative phosphorylation and electron transfer system capacity in BAT. (I) Citrate synthase activity in BAT from WT and Tg mice. (J) Lipolysis was evaluated by measuring glycerol release in isolated BAT. (K) SIRT1 activity was tested in WT and Tg BAT using the acetylation status of RelA(p65) and FOXO1 as readout. All values are presented as mean ± SEM of n = 8–10 mice for each genotype. * indicates statistical significant difference between WT (white bars and circles) and Tg mice (black bars and circles) at P < 0.05.