
Figure 7.
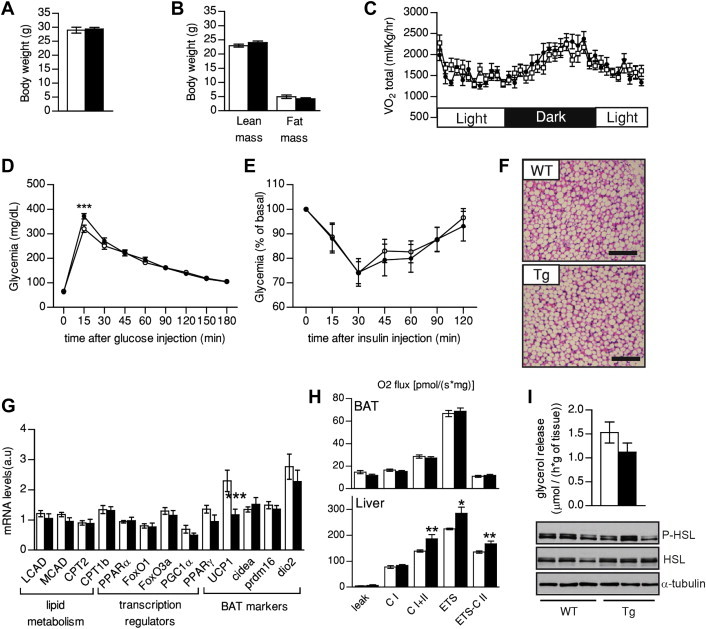
Thermoneutrality blunts the insulin-sensitizing effect of SIRT1 transgenesis. Three months old WT and Tg mice were fed ad libitum with low fat diet and placed at thermoneutrality (30 °C) for one month before phenotyping. Then, (A) Body weight and (B) body composition were measured using Echo-MRI. (C) O2 consumption was evaluated using a comprehensive animal laboratory monitoring system; (D) An intraperitoneal glucose tolerance test and (E) an insulin tolerance test were performed on 4 months old mice. (F) Hematoxylin and eosin stainings of BAT from WT and Tg mice (bar = 600 μm). (G) Total mRNA was extracted from BAT and used for qPCR analysis. (H) Oxidative phosphorylation and electron transfer system capacity in BAT (top) and liver (bottom) of WT and Tg mice. (I) Lipolysis rates were evaluated by measuring glycerol release from BAT. At the bottom HSL and p-HSL levels were evaluated in total BAT protein extracts. All values are presented as mean ± SEM of n = 12 mice for each genotype. * indicates statistical significant difference between WT (white bars and circles) and Tg mice (black bars and circles) at P < 0.05.