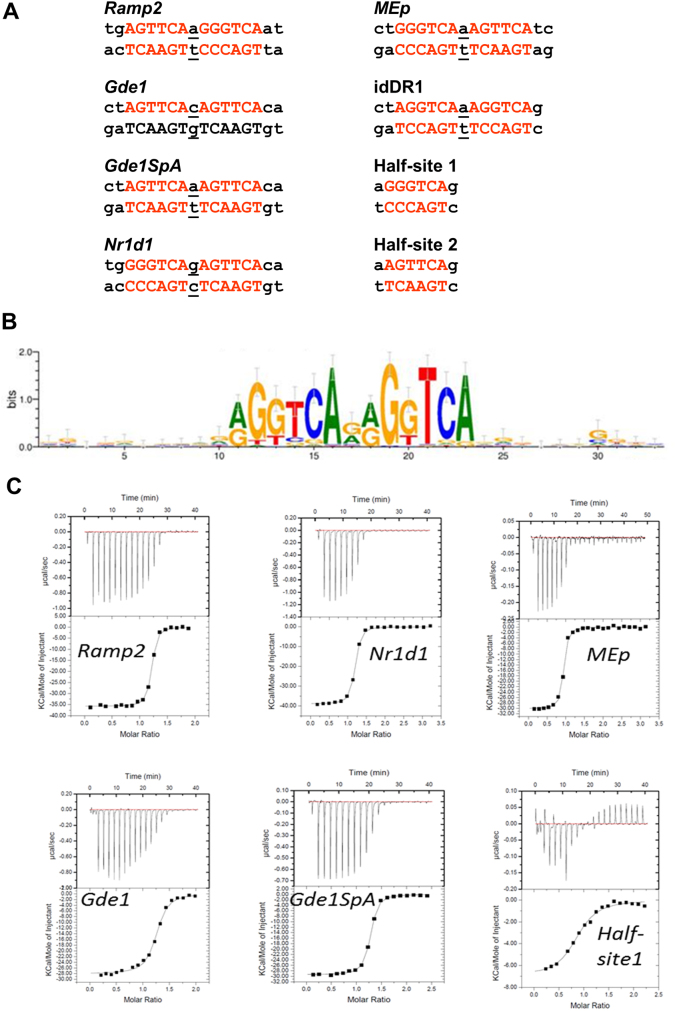
Figure 1.
(a) Natural DR1 response element double strand nucleotide (ds) sequences of DNA DR1 response elements. Hexanucleotide half-site motifs are shown in red. (b) RXR binding motif identified by RXR-ChIP sequencing from Ref. 28. (c) Quantification of the interaction between RXR and DR1s by ITC. Representative ITC isotherms for the binding of the DR1 duplex (Ramp2, Nr1d1, MEp, Gde1, Gde1SpA and half-site 1) to the RXR-DBD. The top panels show the raw ITC data expressed as the change in thermal power with respect to time over the period of titration. Lower panels: change in molar heat is expressed as a function of molar ratio of corresponding DR1 to dimer-equivalent RXR or half-site to monomer RXR. The solid lines in the lower panels represent the fit of data to a one-site model using the ORIGIN software. Standard free energies of binding and entropic contributions were obtained, respectively, as ΔG = −RT ln(Ka) and TΔS = ΔH − ΔG, from the Ka and ΔH values derived from ITC curve fitting.

