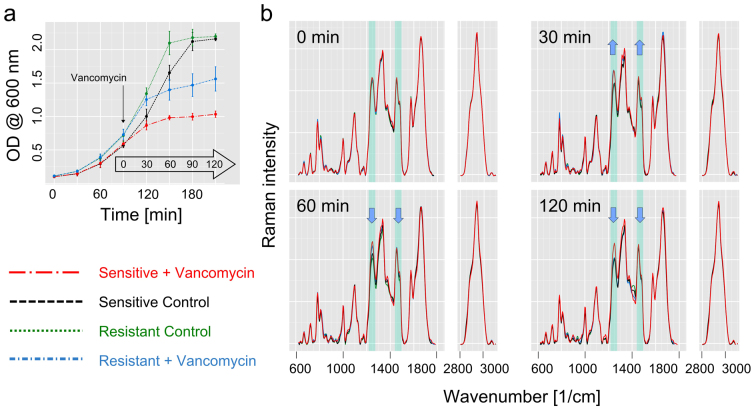
Figure 2. Spectroscopic analysis of E. faecalis at different time points with and without antibiotic treatment.
(a) Bacterial growth curves (average of 9 independent biological replicates) of the sensitive strain with vancomycin treatment (red big chain line) and without (black dashed line) and of the resistant strain with vancomycin treatment (blue small chain line) and without (green dotted line). Vancomycin is added in the exponential growth phase (10 μg/ml). At the indicated time points 0, 30, 60 and 120 min after addition of vancomycin samples were analyzed on the integrated DEP-Raman device. (b) Raman mean spectra at four different time points. Immediately after vancomycin addition (t = 0 min) all Raman spectra look very similar and no significant spectral differences can be identified, proving that the pure presence of vancomycin has no influence on the spectra. After 30 min, spectral changes are observed. In the highlighted spectral regions (at 1236 cm−1 and between 1450 and 1475 cm−1) spectral differences between the vancomycin treated and the untreated control samples are visible. The blue arrows indicate the trend of relative changes for the treated resistant strain. While after 30 min of vancomycin treatment, the low-level resistant E. faecalis strain (MIC = 32 μg/ml) shows similar changes as the sensitive strain, after 60 min, its spectral features become more similar to the control samples, and finally, after 120 min, separation between resistant and sensitive strain is achieved.

