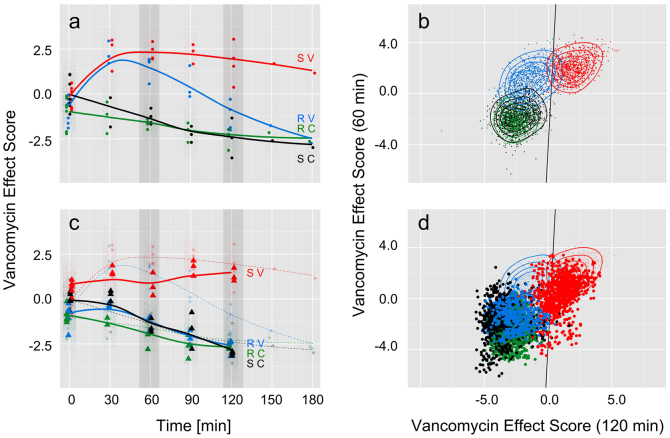
Figure 3. Three-level chemometric model to differentiate resistant and sensitive enterococci.
(a) Vancomycin effect scores of E. faecalis strains plotted over time: PLS-LDA model trained with Raman spectra of treated (red, S V) and untreated (black, S C) sensitive strain after at least 30 min of vancomycin incubation. All data of t = 0 min and data of treated (blue, R V) and untreated (green, R C) resistant strain is projected. At t = 0 min all scores are close together and overlapping, indicating the same starting conditions. At t = 30 min sensitive and the low-level resistant strain show equal vancomycin effect values, treated and untreated strains can be separated. At 60 min the vancomycin effect score of the resistant strain starts to separate from the sensitive strain and reaches between 90 and 120 min negative vancomycin effect values, whereas the sensitive strain remains at positive vancomycin effect score values. The control samples all show up with negative vancomycin effect values and resistant and sensitive strain are not separated, indicating, that the model does not separate between strains but with respect to vancomycin response. (b) Time dependency of the vancomycin effect scores is included in the model by pairing vancomycin effect scores of E. faecalis at 60 min and 120 min and plotting against each other. A LDA is performed with these new scores and the separation line between treated sensitive and resistant strain is drawn in black. Both groups are very well separated from each other. (c) Data of E. faecium (treated and untreated, sensitive and resistant strains, same color code as above) is projected into the vector space spanned by the PLS-LDA shown in (a). In contrast to the low level resistant E. faecalis strain in (a) the high level resistant E. faecium strain immediately separates from the sensitive one and behaves like the control samples. (d) The 60 min and 120 min scores in figure (c) are paired to include time dependency in the model.

