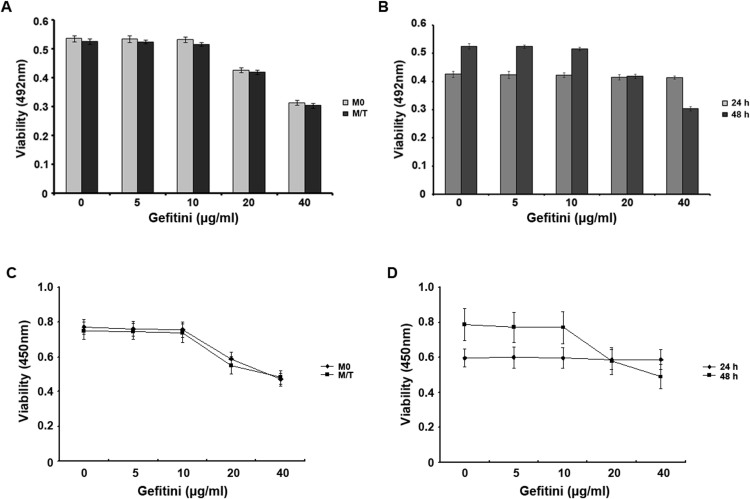
Figure 1. Dose curve and time course of the effect of Gefitinib on the proliferation of MCF-7 and MCF-7/TAM cells.
(A): MCF-7 and MCF-7/TAM cells were treated with different doses of Gefitinib. The absorbance values determined at 492 nm in an ELISA analyser demonstrated that Gefitinib at different concentration gradients exhibited differing degrees of inhibition on cell proliferation. (B): The absorbance values of MCF-7/TAM cells treated with different concentrations of Gefitinib for 24 h or 48 h. Effects on MCF-7 and MCF-7/TAM cell proliferation in different time and different doses of Gefitinib for detection of CCK-8. (C): the effect of different doses of Gefitinib to inhibit the proliferation of M0 and M/T group, there showed inhibitory concentrations of Gefitinib in two kinds of cells for the proliferation. (D): different concentrations of Gefitinib changes in the range of 24 h, 48 h absorbance in group M/T cells. The experiments consisted of the following groups: the MCF-7 group (M0), the MCF-7/TAM group (M/T), and the MCF-7/TAM-Gefitinib (10 μg/ml) group (G10). All the experiments were repeated three times.

