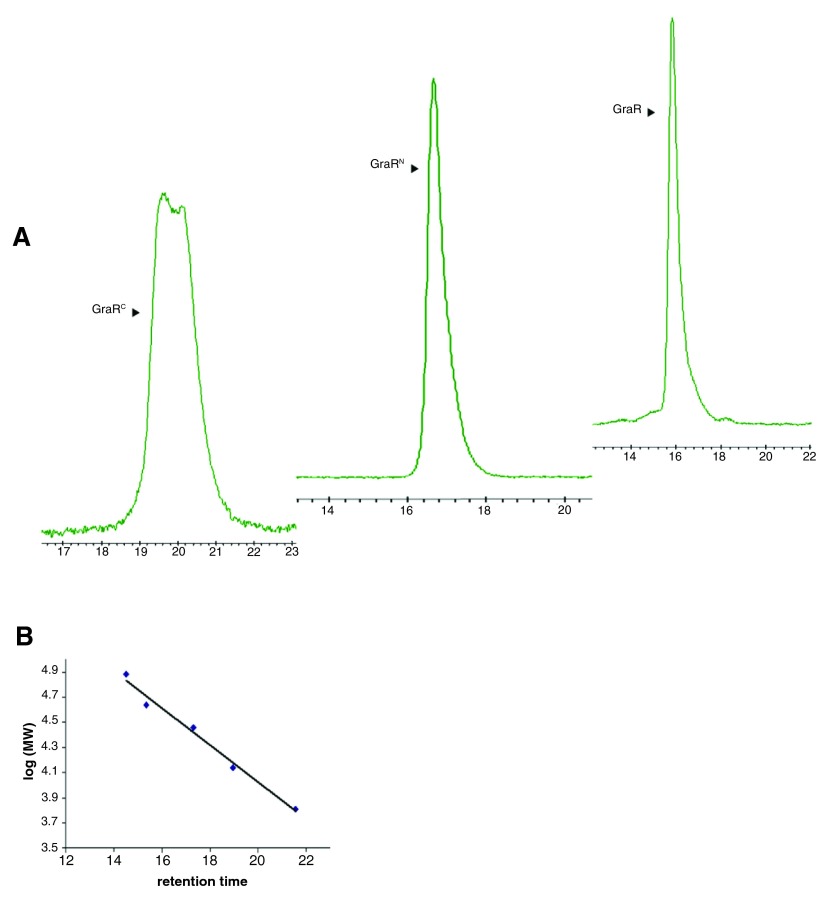
Figure 1. Oligomerization states of GraR, GraR C and GraR N proteins as assessed by size-exclusion chromatography.
A) The chromatographs represent the elution profile of the GraR, GraR N and GraR C proteins on a HPLC size-exclusion TSK Gel (7.8mm × 30cm, 5µm) column calibrated using the following proteins: aprotonin (6.5 kDa), carbonic anhydrase (29 kDa), ribonuclease A (37 kDa), ovalbumin (45 kDa) and conalbumin (75 kDa). B) Calibration graph of log of molecular masses against the retention time of each protein standard.

