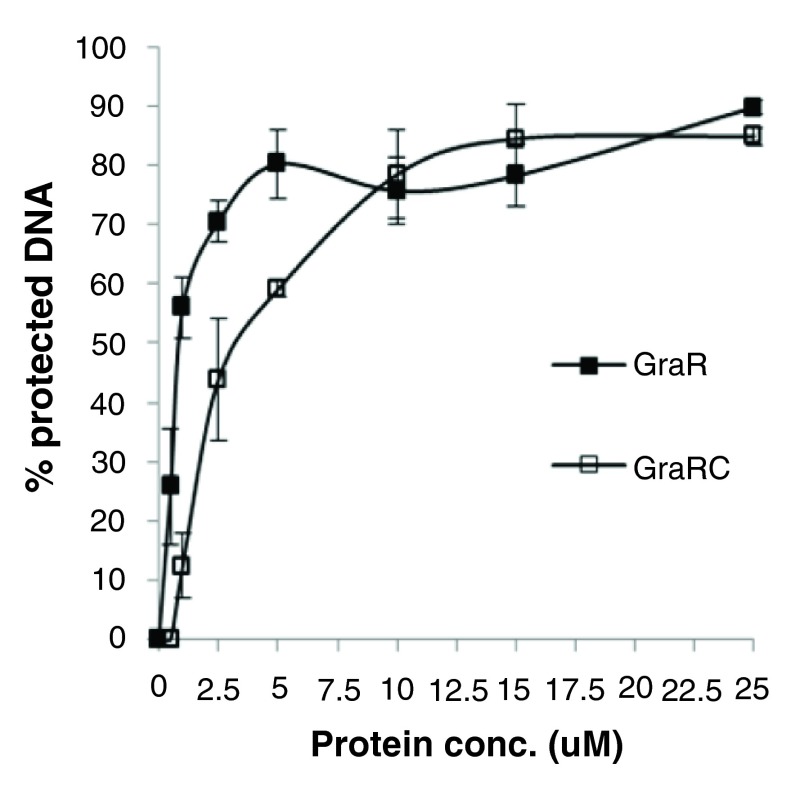
Figure 14. Quantification of DNAse I footprinting data ( Figure 12).
Percentage of protected DNA in the region -110- to -133 is plotted against protein concentration used in the assay. We used the intensity of four most prominent bands in the GraR-protected region as measured using ImageJ (NIH software) and averaged them out to calculate the percentage of protected DNA. Error bars indicate standard error of mean calculated from three independent experiments.

