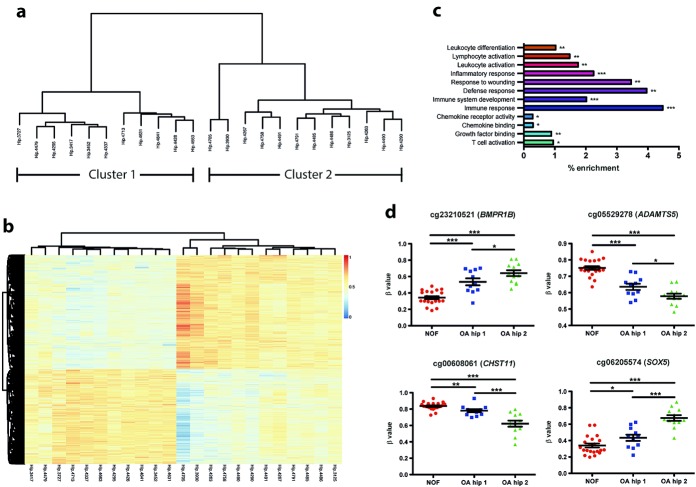
Figure 2.
Segregation of cartilage chondrocyte DNA from patients with hip osteoarthritis (OA) based on the methylation profile. a, Unsupervised hierarchical clustering of the global β values in the hip OA samples, which revealed 2 distinct clusters. b, Heatmap showing the unsupervised clustering of the 15,239 differentially methylated loci (DMLs) identified between the 2 hip OA clusters. DMLs were defined as those with at least a 10% difference in methylation between the 2 groups and with a Benjamini-Hochberg corrected P value of less than 0.05. Dendrogram at the top shows the clustering of the samples. Dendrogram at the left shows the clustering of the loci. The methylation scale is shown to the right of the heatmap (1 = 100% methylation; 0 = no methylation). c, Gene ontology pathway analysis of the 15,239 DMLs. ∗ = P ≤ 0.05; ∗∗ = P ≤ 0.01; ∗∗∗ = P ≤ 0.001, after Benjamini-Hochberg correction for multiple tests. d, Analysis of 4 selected loci found to be differentially methylated in hip OA versus femoral neck fracture (NOF) samples and between hip OA clusters 1 and 2 (OA hip 1 and 2). Each data point represents a single sample; horizontal lines and error bars show the mean ± SEM. ∗ = P ≤ 0.05; ∗∗ = P ≤ 0.01; ∗∗∗ = P ≤ 0.001, by one-way analysis of variance. Color figure can be viewed in the online issue, which is available at http://onlinelibrary.wiley.com/doi/10.1002/art.38713/abstract.

