
Figure 4.
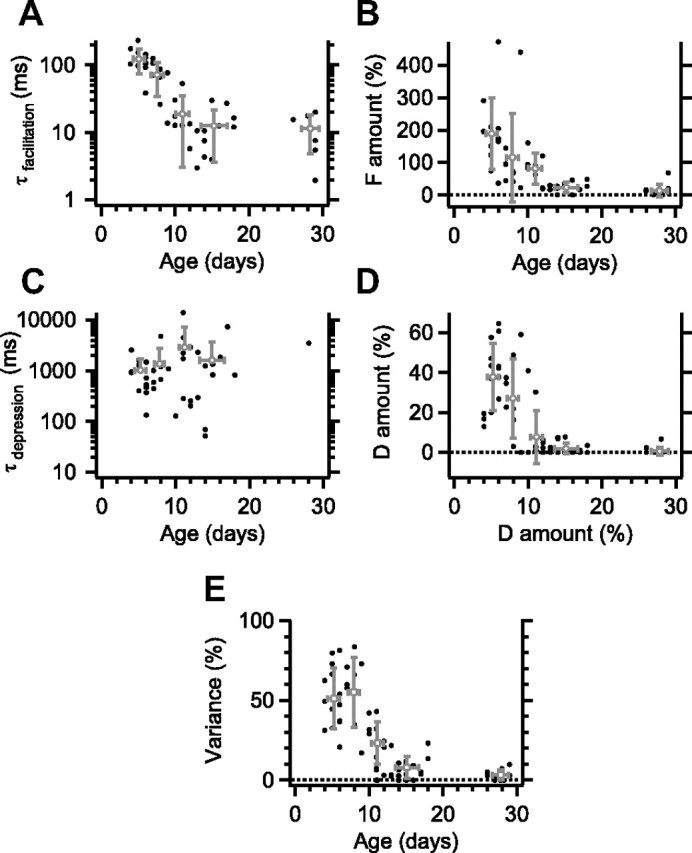
Developmental changes in STP. A, Developmental decrease in the time constant of facilitation, as obtained from the fit with an STP model. Only cells that showed significant facilitation are included (45 of 65 cells). Gray symbols show binned averages with SDs. B, As in A, showing the developmental changes in the amount of facilitation (53 of 65 cells). All cells are included, except when they showed only depression. Cells without significant facilitation are included as 0%. C, Age dependence of the time constant for recovery from depression as obtained from the fit in cells with significant depression (42 of 65 cells). D, Developmental decrease in the amount of depression. Cells without significant depression are included as 0%. E, Developmental decrease in the percentage of variance that can be explained by the model fit (coefficient of determination). Cells without both significant facilitation and depression are included as 0%.