
Figure 5.
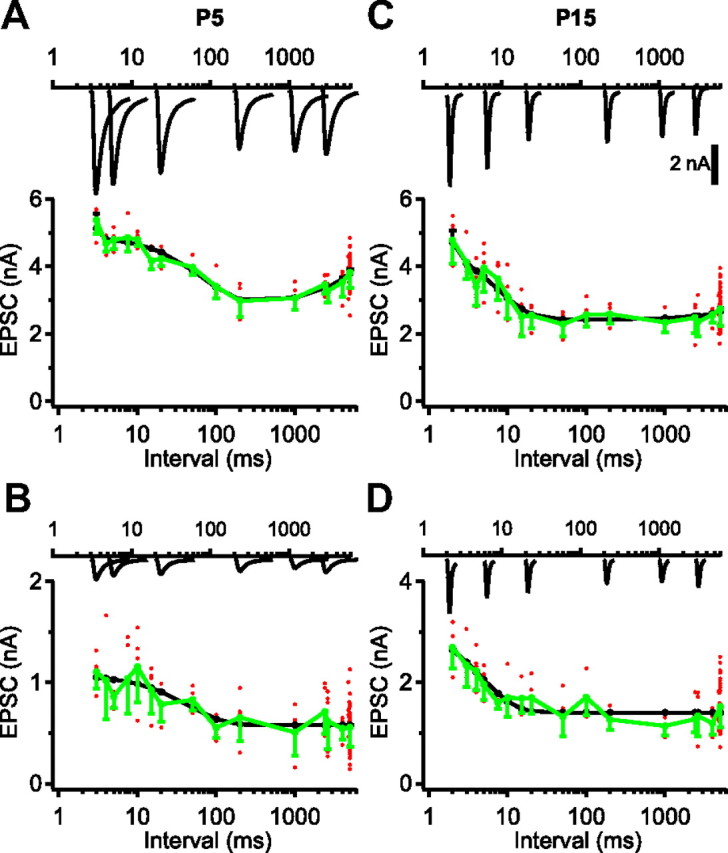
Developmental changes in STP during paired-pulse stimulation in slice recordings. A, Top, Example EPSCs obtained at the indicated interval in a P5 whole-cell voltage-clamp experiment at 1.2 mm calcium. Bottom, Red dots show individual EPSC amplitudes, green symbols show binned averages with SD, and black circles show fit with an STP model with both facilitation and depression. Fit parameters were as follows: amplitude 5.2 nA; 74% facilitation per AP, decaying with a time constant of 72 ms; and 25% depression per AP, decaying with a time constant of 6.5 s. The fit could account for 68% of the variance in the EPSC amplitudes. B, As in A, except the calcium concentration was lowered to 0.6 mm. Fit parameters were amplitude 0.6 nA, 87% facilitation per AP, decaying with a time constant of 47 ms. The fit could account for 43% of the variance in the EPSC amplitudes. C, As in A, except the recording was from a P15 neuron. Fit parameters were as follows: amplitude 3.4 nA; 104% facilitation per AP, decaying with a time constant of 7.3 ms; and 9% depression per AP, decaying with a time constant of 10.9 s. The fit could account for 57% of the variance in the EPSC amplitudes. D, As in C, except that calcium concentration was lowered to 0.6 mm. Fit parameters were as follows: amplitude 1.4 nA; 136% facilitation per AP, decaying with a time constant of 4.6 ms. The fit could account for 42% of the variance in the EPSC amplitudes. The scale bar for EPSCs in C also pertains to EPSCs shown in A, B, and D.